First Quarter Effect in Stocks
Earlier this
year, we researched a so-called January Effect on the stock market. In that
article, we found evidence that there is a stronger correlation between
positive market returns in January and positive 12 month returns, than when
returns are negative in January preluding negative 12 month returns.
In a recent article on seekingalpha.com, Tiger Technologies ventured to
find whether there is a relationship between first quarter returns (returns in
the first three months of a year) and full year returns, or whether there is a
First Quarter Effect. The company’s conclusions confirmed such a relationship,
and observed that it is quite similar to the January Effect.
Tiger Technologies took the quarterly and annual returns of the S&P
500 index over the period 1952-2013 and ran a correlation analysis of first
quarter returns and the returns for the rest of the year. They found that the
first quarter had the highest correlation (15%) among all quarters to the
performance of the sum of the remaining three quarters (from -5% to 13%).
They looked deeper and studied the direction and size of those returns
and found that 39% of the studied years (23 years) had negative first quarter
returns. Out of those 23 years, only 10 years, or 43%, saw full year results
negative as well. This resembles the evidence about the January Effect: a negative
start of the year does not necessarily indicate that the rest of the year will
also be negative.
As to positive first quarters, first quarter returns were in the black
in 36 out of 59 years. In 33 years (92% of 36), the full year stock market return
was also positive. In other words, a positive first quarter has 92% of the time
led to a positive full year return.
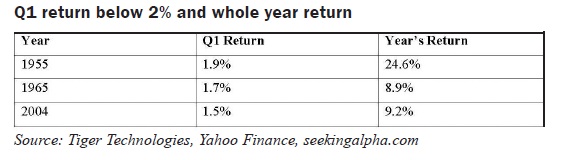
Tiger Technologies used this analysis to forecast the S&P 500 index
result for 2014. In Q1/2014, the S&P 500 index grew by 1.7%. The company’s
analysis showed that a positive first quarter has led to a positive year 92% of
the time and a first quarter growth of 1%-2% has led to a positive year 100% of
the time (although there were only three such years between 1952-2013, see the
table).
This sounds quite good in terms of S&P 500 chances to have a
positive return in 2014. At the same time, we would like to warn those who may
want to quantify what the S&P 500 return would be for the whole year 2014
based on this analysis. The average return for S&P 500 in those three years
was 14.2%. However this number cannot be used to gauge this year’s performance
because, in particular, the data, which was used for this study, is limited.
And we have to cite our usual caveat in this kind of situations: past
performance is no guarantee of future returns.
Michael Zienchuk, MBA, CIM
Investment Advisor, Credential Securities
Inc.
Manager, Wealth Strategies Group,
Ukrainian Credit Union Limited
416-763-5575 x204 mzienchuk@ukrainiancu.com
www.ukrainiancu.com
Mutual funds and other securities are offered through Credential
Securities Inc. Commissions, trailing commissions, management fees and expenses
all may be associated with mutual fund investments. Please read the prospectus
before investing. Unless otherwise stated, mutual funds and other securities
are not insured nor guaranteed, their values change frequently, and past
performance may not be repeated. The information contained in this article was
obtained from sources believed to be reliable; however, we cannot guarantee
that it is accurate or complete. This article is provided as a general source
of information and should not be considered personal investment advice or
solicitation to buy or sell any mutual funds and other securities. The views
expressed are those of the author and not necessarily those of Credential
Securities Inc. Credential Securities Inc. is a Member of the Canadian Investor
Protection Fund.